Medium Blog: Journey through COVID-19 RSNA Papers
 Image credit:
Adapted from Wong et al.
Image credit:
Adapted from Wong et al.
Disclaimer: I am neither a radiologist nor a clinician. I am a computer scientist who have been working on medical image computing for a while. I tried to summairze the key findings reported in almost 15 papers published in the Radiology Society in North America (RSNA) in the last two months.
CT Imaging features
Key CT findings have been studied and investigated by Guan et al. [10] in a large cohort of 1099 patients with confirmed COVID-19, and Chung et al. [1] in a group of 21 patients infected with COVID-19 in China. Their key results that majority of RT-PCR confirmed patients (some are asymptomatic) show typical CT findings such as the presence of bilateral ground-glass opacities (GGO) and/or consolidation, with a rounded morphology and a peripheral lung distribution (cf. Fig.1). In another cohort of 104 patients, from the cruise ship “Diamond Princess”, Inui et al. [4] have reported similar findings of lung opacities and airway abnormalities in both asymptomatic and symptomatic cases. In addition to the key characteristics of peripheral GGO, Caruso et al. [7] have also observed an association with sub-segmental vessel enlargement (> 3 mm) in his cohort of 158 participants from Italy (cf Fig.2).
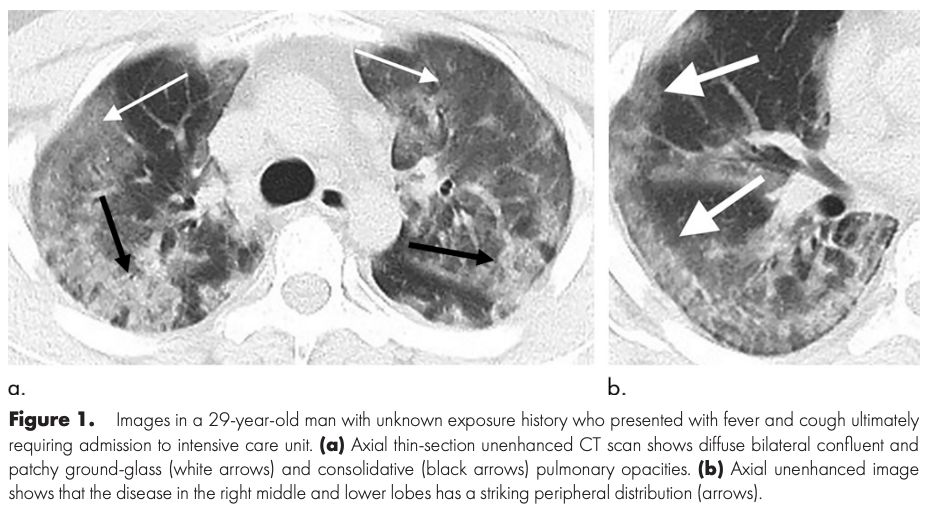 Fig.1: Image adopted from Chung et al. [1]
Of 21 patients with the 2019 novel coronavirus, 15 (71%) had involvement of more than two lobes at chest CT, 12 (57%) had ground-glass opacities, seven (33%) had opacities with a rounded morphology, seven (33%) had a peripheral distribution of disease, six (29%) had consolidation with ground-glass opacities, and four (19%) had crazy-paving pattern. [1]
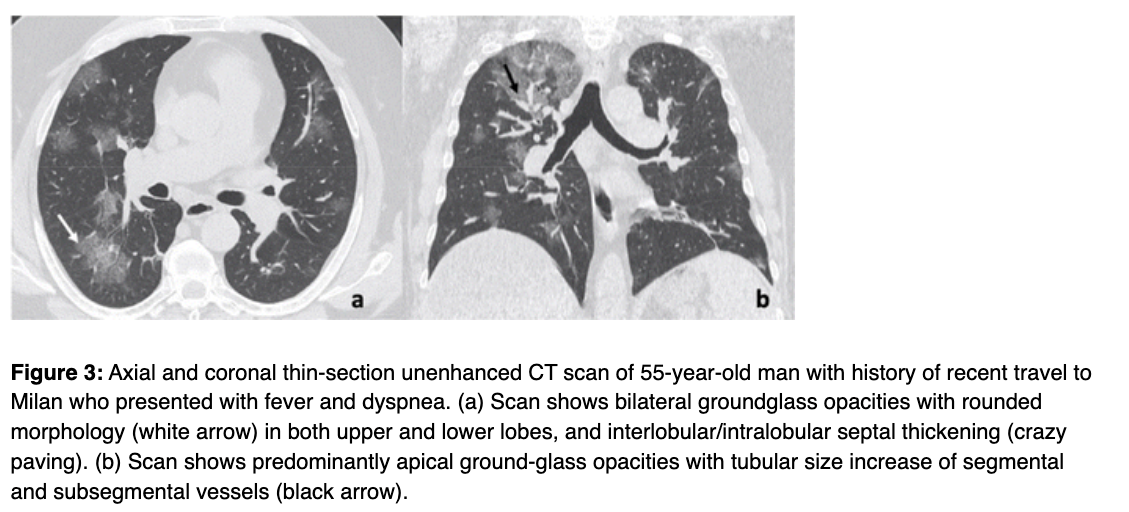 Fig.2: Image adopted from Caruso et al. [7]
Surprisingly, 14% of the patients (3 out of 21), studied by Chang et al. [1], show negative CT findings in their initial chest CT scan. Follow-up scans, however, show rounded peripheral ground-glass opacity (cf. Fig.3). Xie et al. [3] and Caruso et al. [7] have also reported similar percentages of 4% (7 out of 167), and 3% (2 out of 62), respectively, of their cohorts who show no findings in their CT scans.
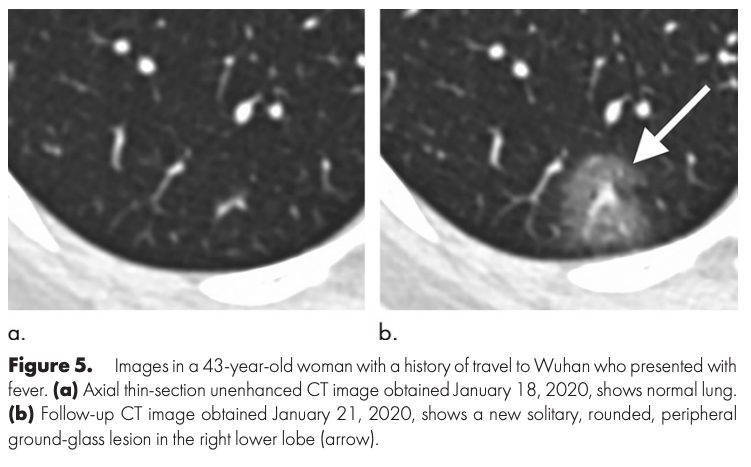 Fig.3: Image adopted from Chung et al. [1]
Contrary, Xie et al. [3] found out that 3% of their cohort (5 out of 167), who had initially negative RT-PCR, show positive Chest CT with similar findings of viral pneumonia reported by Chung et al. [1] (cf Fig.4). A few days later, and after repeated swap tests, the RT-PCR had become positive. This has been. also confirmed in another cohort, reported by Fang et al. [8], where the percentage was around 29% (15 out of 51).
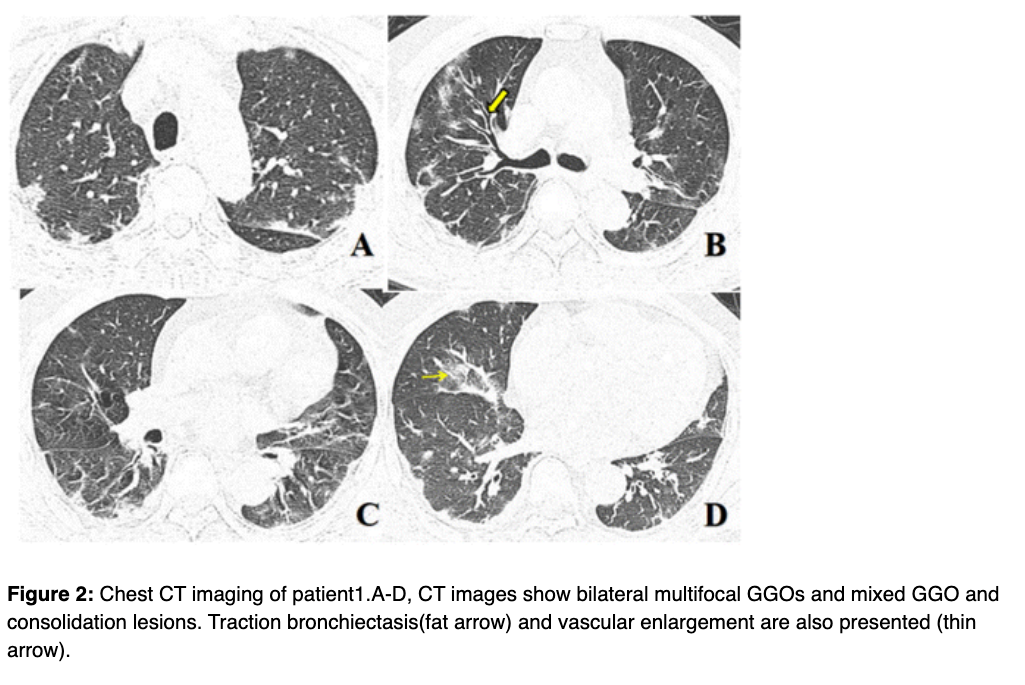 Fig.4: Adopted from Xie et al. [3]
Chest CT vs. RT-PCR
Given the aforementioned key characteristics of COVID-19, the low sensitivity of the RT-PCR test (42–71%) [6], and the long mean interval time between the initial negative to positive RT-PCR (5.1 +/- 1.5 days), clinicians and researchers have investigated whether diagnostic imaging features could be used an alternative to RT-PCR in screening.
In patients at high risk for 2019-nCoV infection, chest CT evidence of viral pneumonia may precede positive negative RT-PCR test results. [3]
A few recent studies (Ai et al. [6], Caruso et al. [7], Fang et al. [8]) have investigated the correlation of Chest CT findings and RT-PCR test reporting high sensitivity of 97–98% for Chest CT in diagnosing COVID-19. Detailed evaluation metrics against the RT-PCR are reported below. Interestingly, 98% of the patients (56 out of 57), reported by Ai et al. [6], who had initially positive CT findings show positive RT-PCR within 6 days (cf Fig.5). Such interesting results suggest chest CT could be considered for screening.
In a series of 51 patients with chest CT and RT-PCR assay performed within 3 days, the sensitivity of CT for COVID-19 infection was 98% compared to RT-PCR sensitivity of 71% (p<.001) [2]
| Papers | Sample Size | Country | Sensitivity | Specificity | Accuracy |
|---|---|---|---|---|---|
| Caruso et al. [7] | 58 | Rome, Italy | 97% | 56% | 72% |
| Ai et al. [6] | 1014 | Wuhan, China | 97% | 25% | 68% |
| Fang et al. [8] | 51 | Shanghai, China | 98% | N/A | N/A |
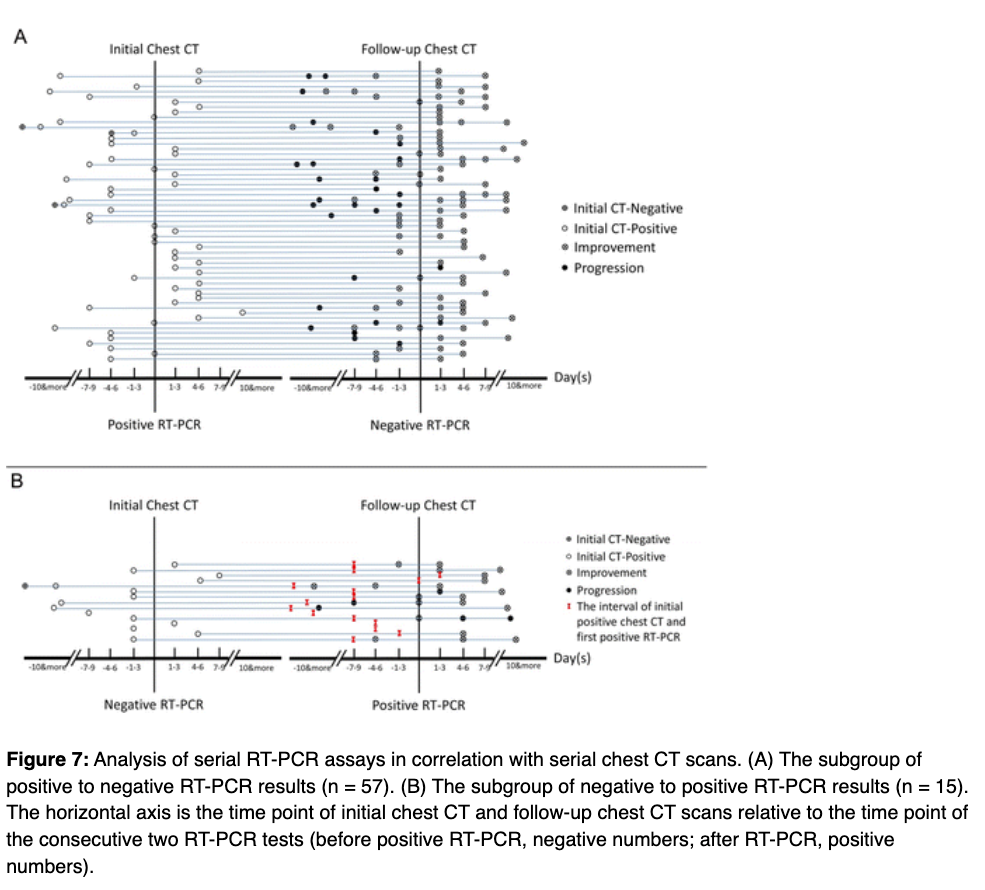 Fig.5: Adopted from Ai et al. [6]
Discrepancy between CT findings and RT-PCR motivated clinicians and researchers to analyze the serial CT findings over time (Wang and Dong et al. [9], Pan et al. [12]) and study the relationship to duration of infection (Bernheim et al. [11]). As reported in their analysis (Fig. 6, 7,8), the appearance of GGO and Consolidations varies over time explaining the discrepancy in the sensitivity. Both studies suggest, however, pathology quantification might help in the prognosis.
The extent of CT abnormalities progressed rapidly after the onset of symptoms, peaked around 6–11 days, and followed by persistence of high levels in lung abnormalities. The temporal changes of the diverse CT manifestations followed a specific pattern, which might indicate the progression and recovery of the illness. [7]
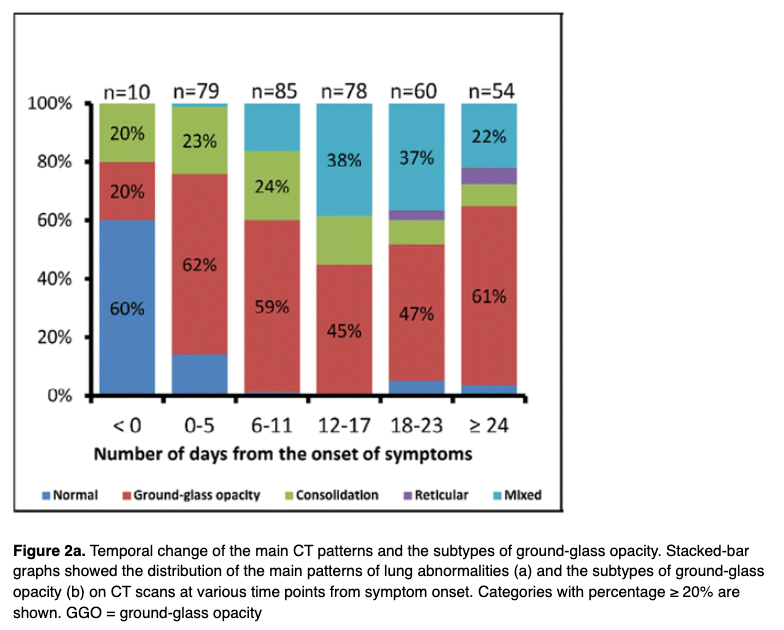 Fig. 6: Adopted from Wang and Dong et al. [9]
Recognizing imaging patterns based on infection time course is paramount for not only understanding the pathophysiology and natural history of infection, but also for helping to predict patient progression and potential complication development. [11]
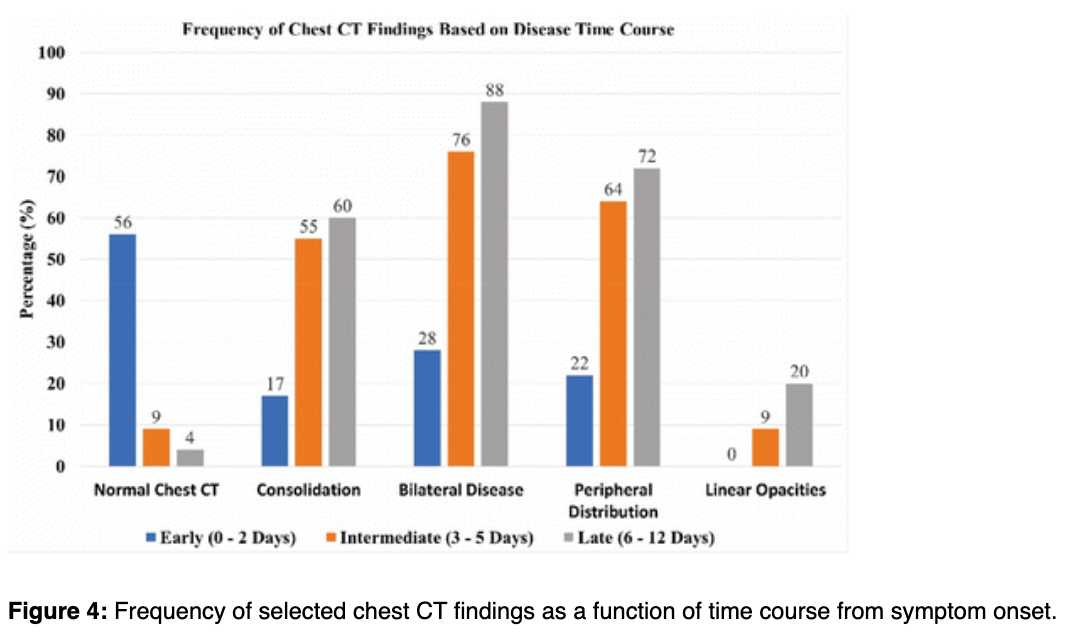 Fig. 7: Adopted from Bernheim et al. [11]
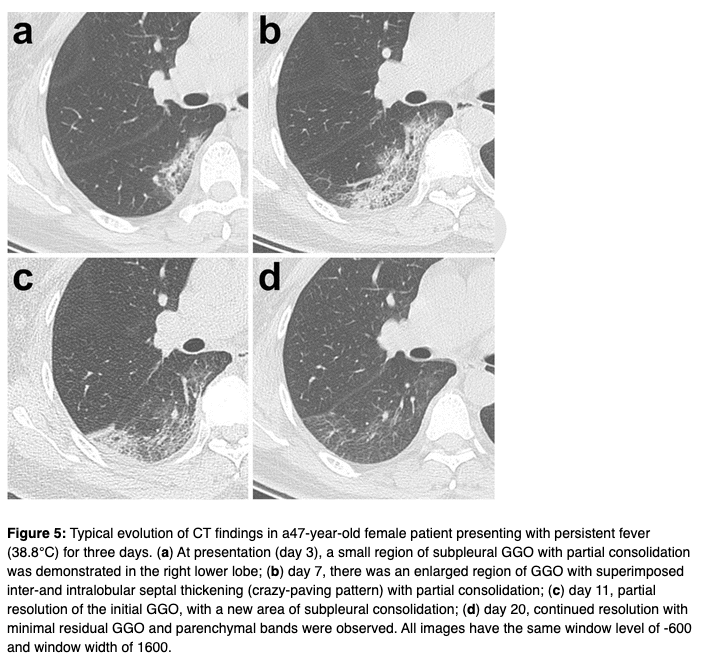 Fig.8: Adopted from Pan et al. [12]
Chest X-ray vs. RT-PCR
Given the limited resources, and to minimize the risk of cross-infection [14], and contamination, clinicians and researchers have investigated whether a readily available diagnostic imaging, namely X-ray, could be used as a first-line triage tool, and help in detecting abnormalities associated with COVID-19 in Chest X-rays, in particular, for asymptomatic patients.
One of the interesting studies reported by Wong et al. [13] who have studied the appearance of COVID-19 in Chest X-ray, and its correlation with the key findings in the CT scans. Besides, they have investigated the correlation of Chest X-ray and RT-PCR test.
In their cohort of 64 patients from Hong Kong, they observed similar key characteristics, appeared in CT scans, such as bilateral, peripheral ground-glass opacity, and/or consolidations (cf. Fig. 9).
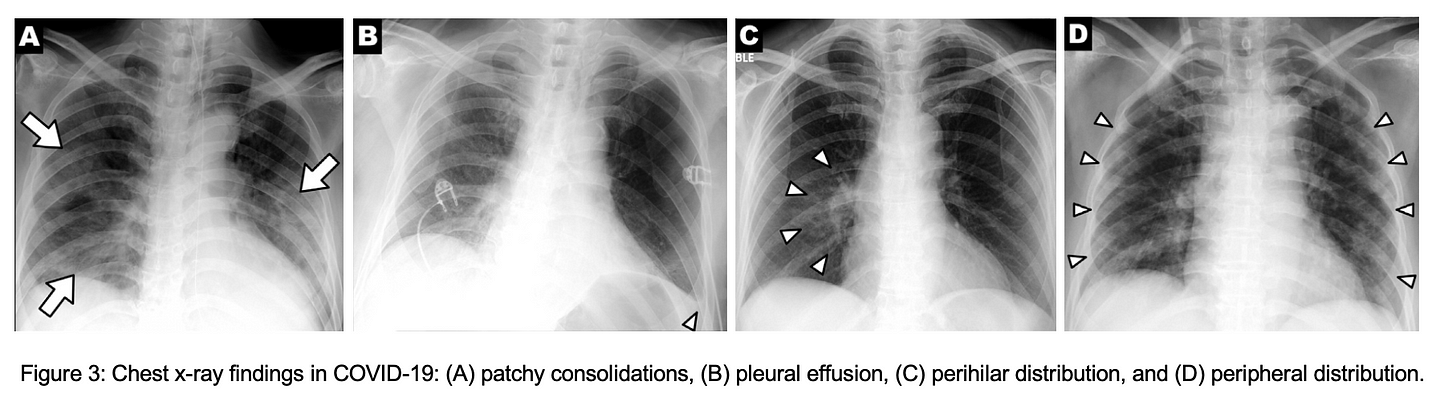 Fig. 9: Adapted from Wong et al. [13]
In contrast to the high sensitivity reported for the CT scans, Wong et al. [13] reported a sensitivity of 69% for Chest X-ray, compared to 91% for the initial RT-PCR. The Chest X-ray abnormalities preceded the positive RT-PCR only in 9% (6 out of 64 patients). Examples on the latter scenario are demonstrated in Fig. 10 (A, and B).
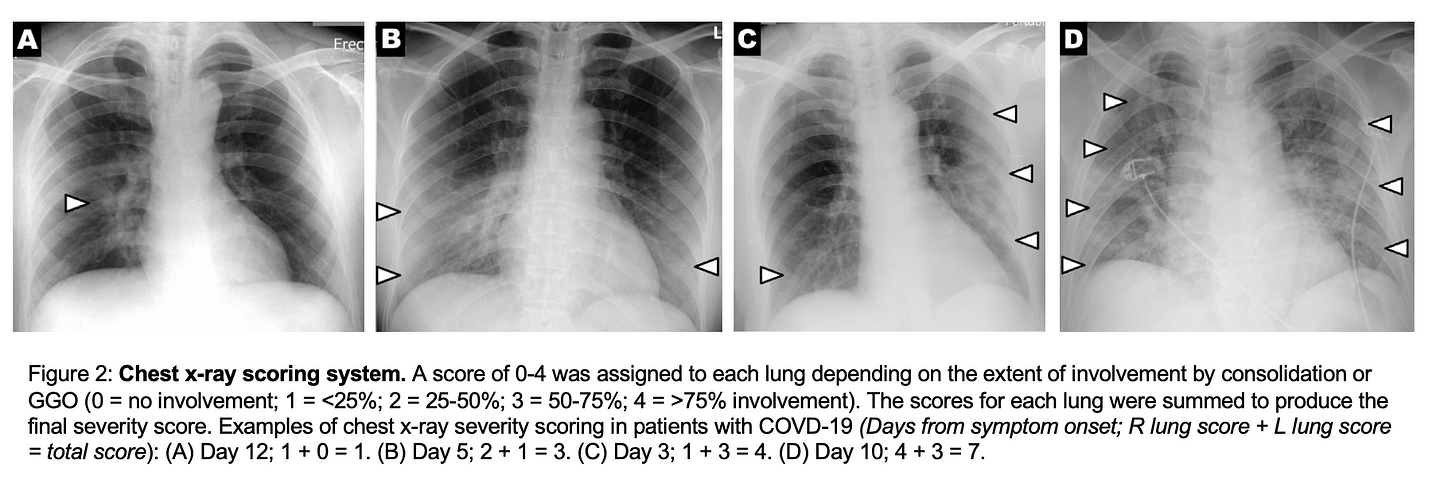 Fig. 10: Adapted from Wong et al. [13]
The remarkable low sensitivity indicates a high number of False Negative suggesting further investigation of the abnormalities change over time. Fig.11 shows the changes of severity score in Chest X-ray, where the peak score was reported in 10–12 days since symptoms onset.
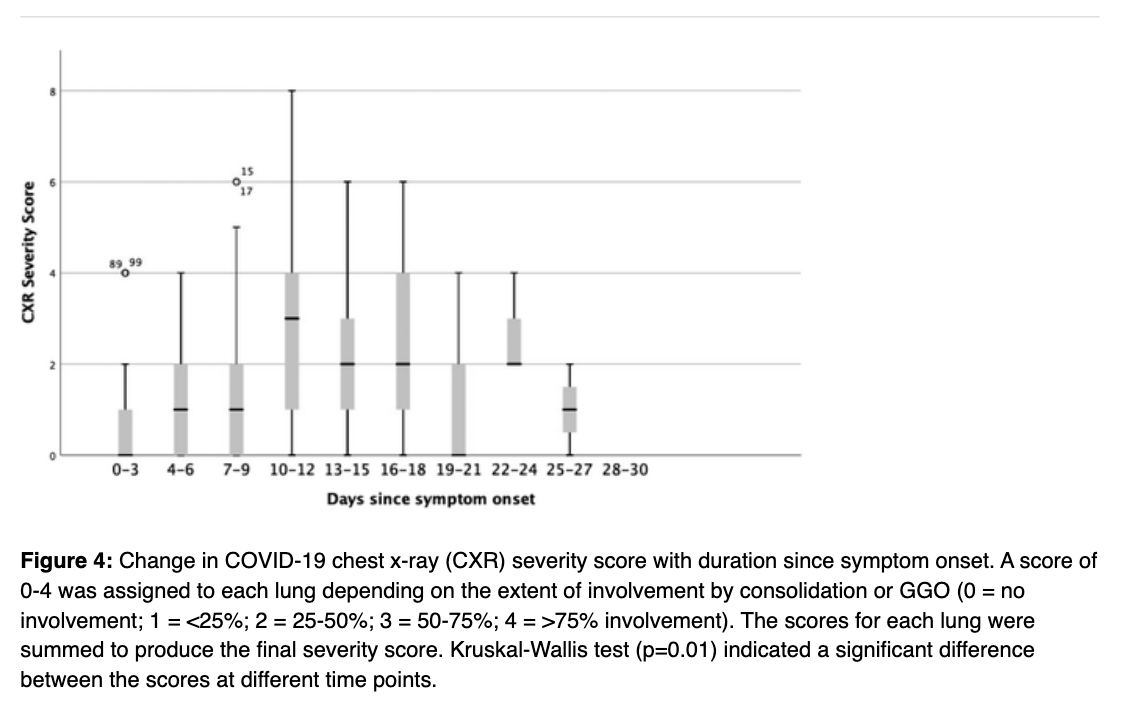 Fig.11: Adopted from Wong et al. [13]
Surprisingly, 86% of the patients (24 out of 28) who had initial positive Chest X-ray, show positive findings on the CT as well. Whereas only one patient of the rest shows no findings in the Chest X-ray, the CT shows peripheral GOO (cf. Fig.12). These results suggest Chest X-ray might be helpful in monitoring and prognosis, but not recommended for screening.
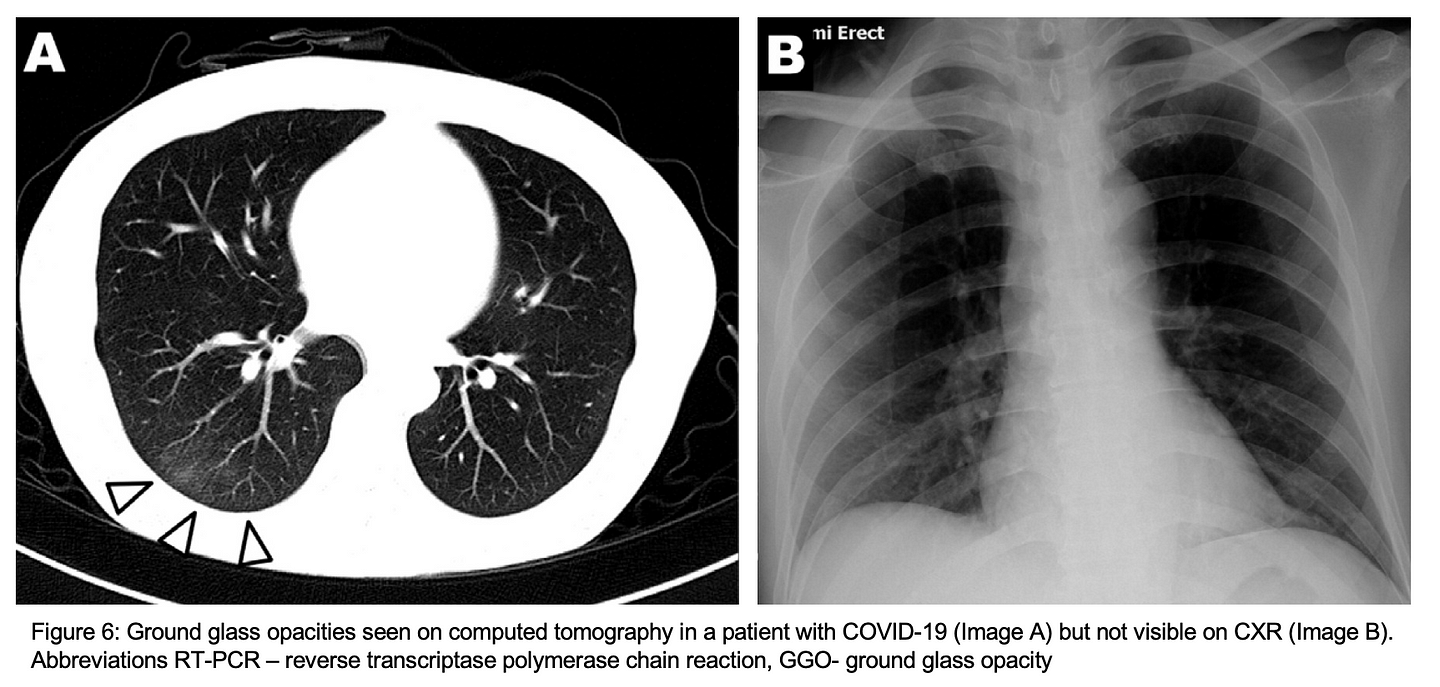 Fig. 12: Adapted from Wong et al. [13]
At this time, CT screening for the detection of COVID-19 is not recommended by most radiological societies. However, we anticipate that the use of CT in clinical management as well as incidental findings potentially attributable to COVID-19 will evolve. [15]
Community Acquired Pneumonia (CAP) vs. COVID-19
So far, previous studies report high sensitivity in diagnosing COVID-19 from CT scans, however, with remarkable low specificity, e.g. 25%, and 56% in Ai et al. [6], and Caruso et al. [7], respectively. In other words, radiologists might misinterpret the CT scan and diagnose the patient with COVID-19.
These studies have shown that COVID-19 often produces a CT pattern resembling organizing pneumonia, notably peripheral ground-glass opacities (GGO) and nodular or mass-like GGO that are often bilateral and multilobar ( 11). However, additional imaging findings have also been reported including linear, curvilinear or perilobular opacities, consolidation, and diffuse GGO, which can mimic several disease processes including other infections, inhalational exposures, and drug toxicities ( 12 –15). [15]
To assess the performance of radiologists in differentiating COVID-19 from other viral infections, Bai and Hsieh et al. [16] collected a cohort of 424 chest CT scans; 52% with positive COVID-19 by RT-PCR test, and 48% with positive Respiratory Pathogen Panel for viral pneumonia. The cohort was blindly reviewed by three radiologists from China, and a subset of 58 patients were reviewed by four radiologists from the US. Overall, their results demonstrate that radiologists can distinguish COVID-19 from other viral pneumonia with moderate to high sensitivity 67–93%, and high specificity 93–100%. Misinterpreted cases show either subtle or atypical findings in their CT scans (cf. Fig. 13). Key differences have been also reported by the radiologists.
Compared to non-COVID-19 pneumonia, COVID-19 pneumonia was more likely to have a peripheral distribution (80% vs. 57%, p<0.001), ground-glass opacity (91% vs. 68%, p<0.001), fine reticular opacity (56% vs. 22%, p<0.001), and vascular thickening (59% vs. 22%, p<0.001), but less likely to have a central+peripheral distribution (14.% vs. 35%, p<0.001), pleural effusion (4.1 vs. 39%, p<0.001) and lymphadenopathy (2.7% vs. 10.2%, p<0.001).
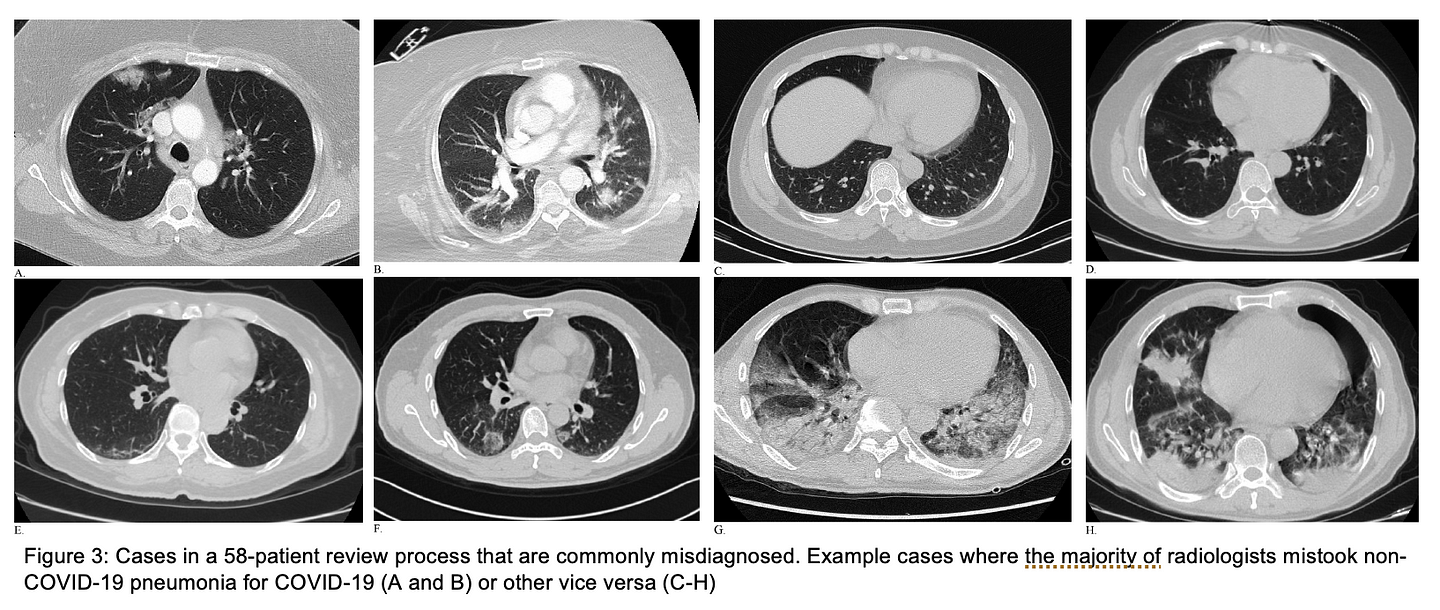 Fig.13: Adapted from Bai and Hsieh et al. [16]
To reduce the reporting variability and uncertainty which might arise due to incidental findings with other viral infections, e.g. influenza-A, Simpson and Kay et al. [15] put together a nice piece of work and suggestions on standardized CT reporting language of COVID-19, which could be considered as a good reference for structured reporting. Examples of suggested reporting languages along with a few chest CT images are demonstrated in Fig. 14–16.
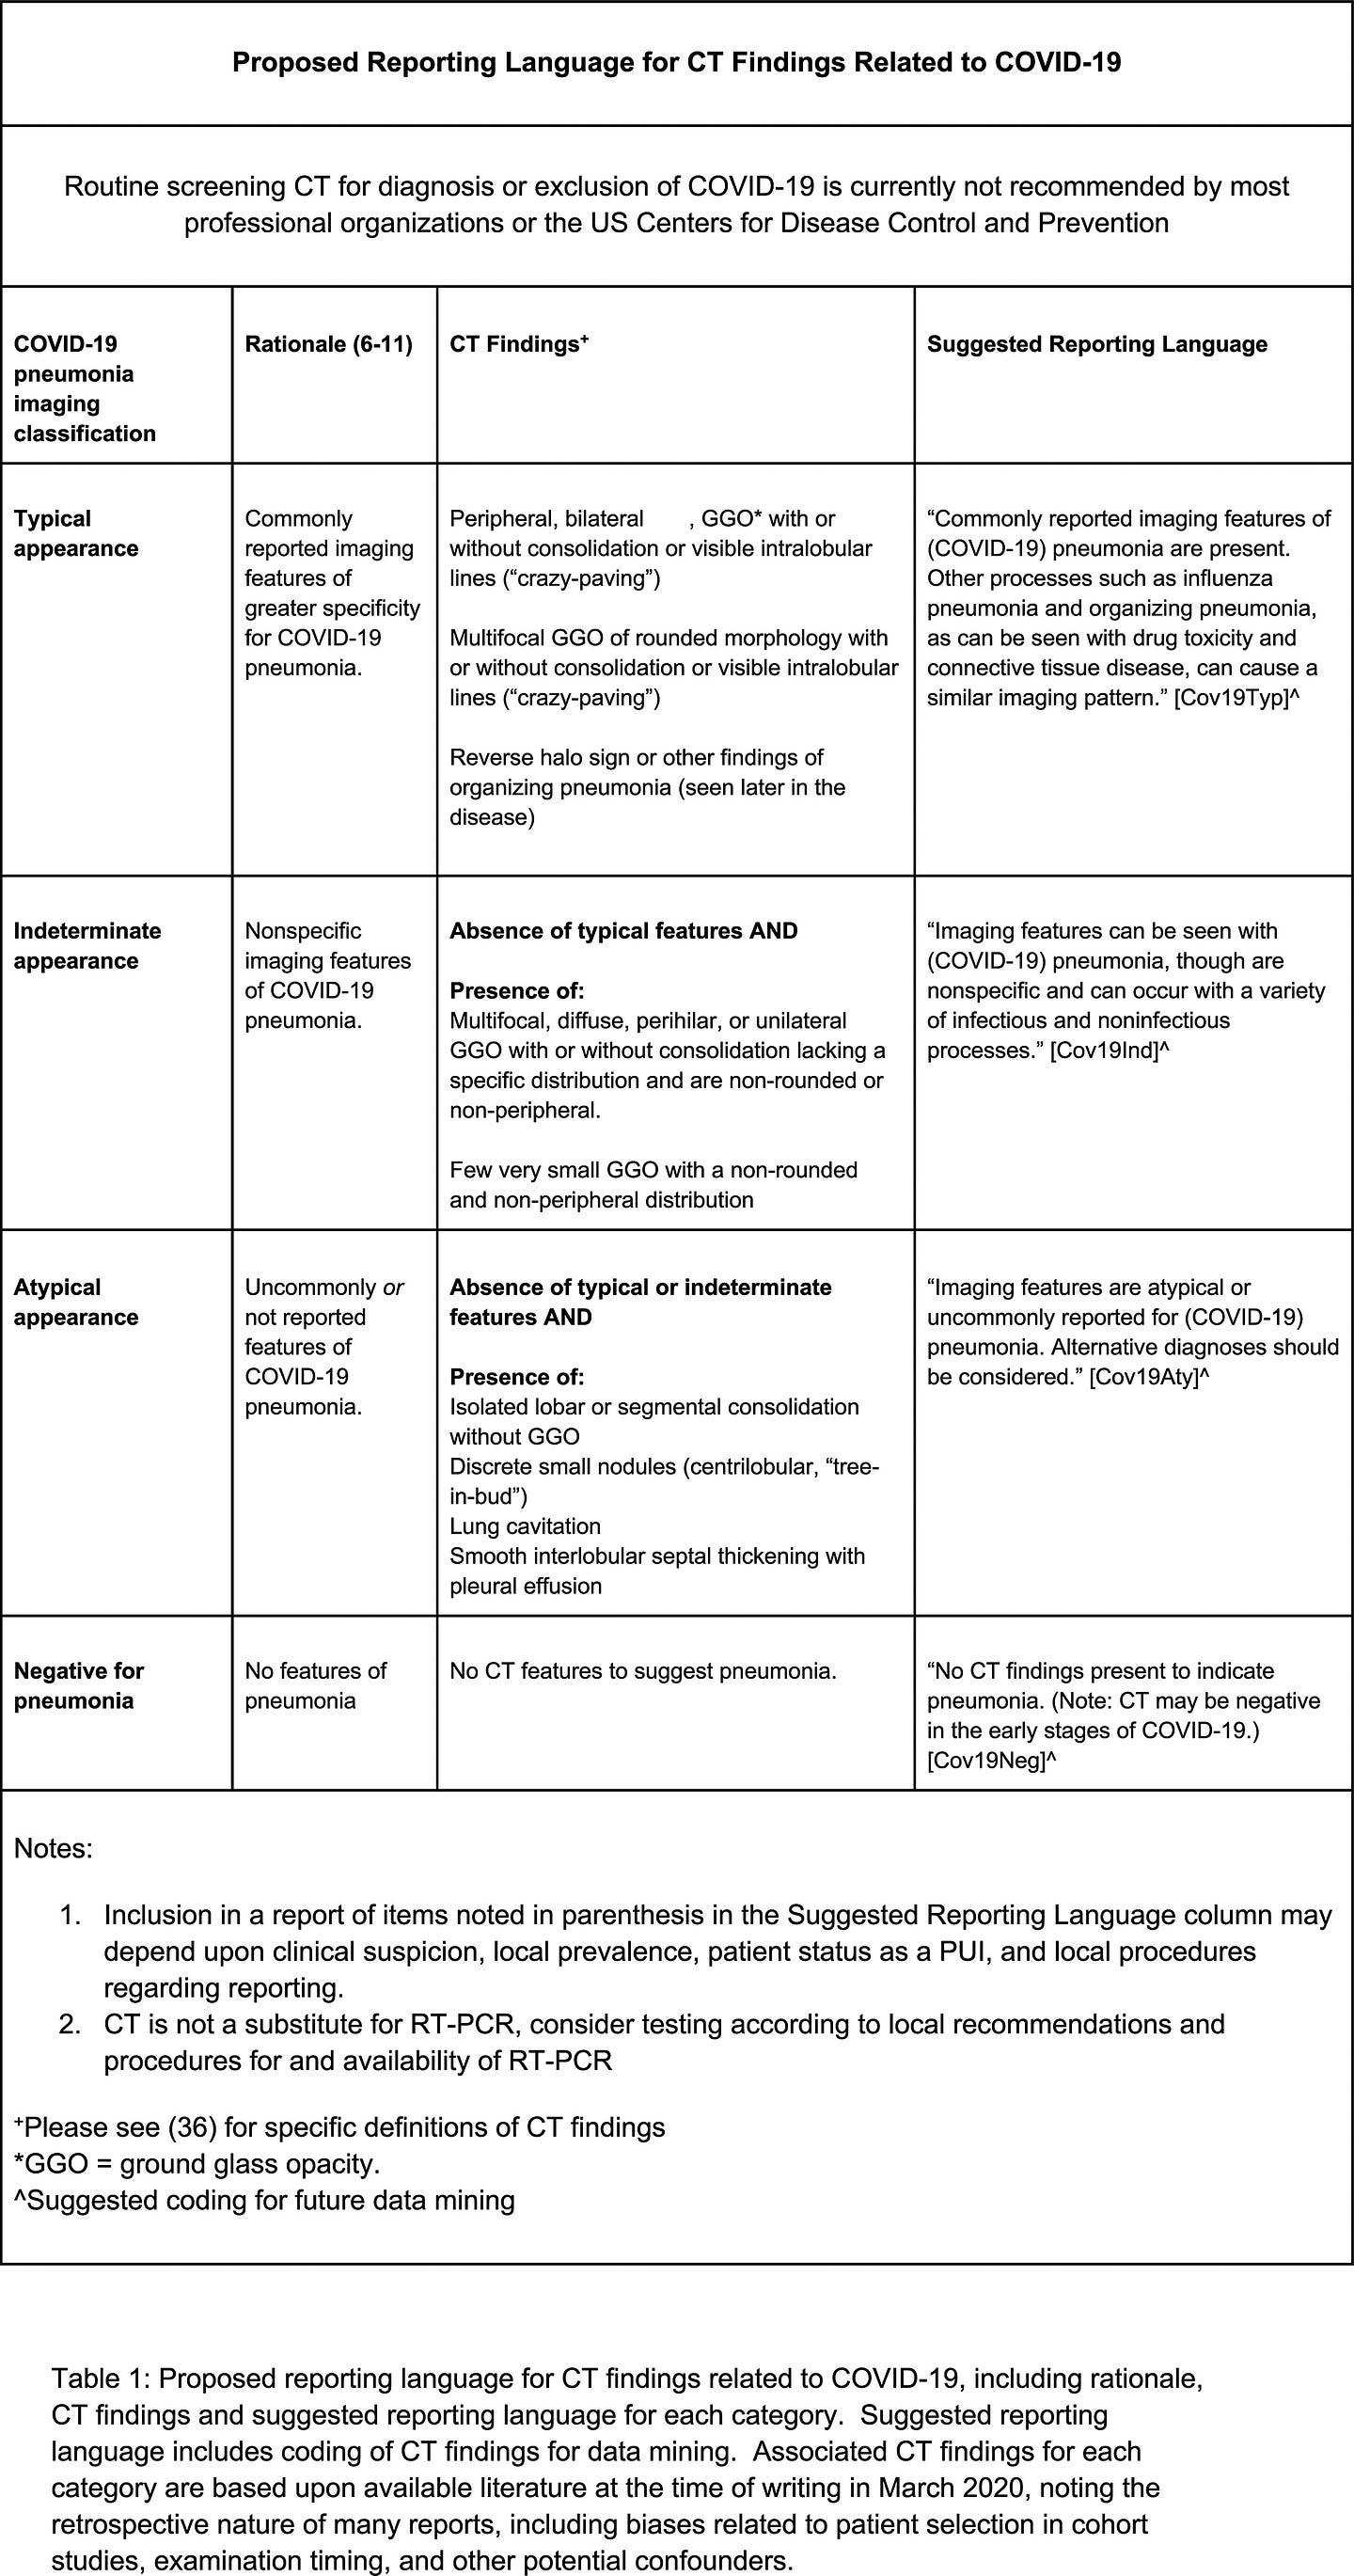 Fig.14: Adopted from Simpson and Kay et al. [15]
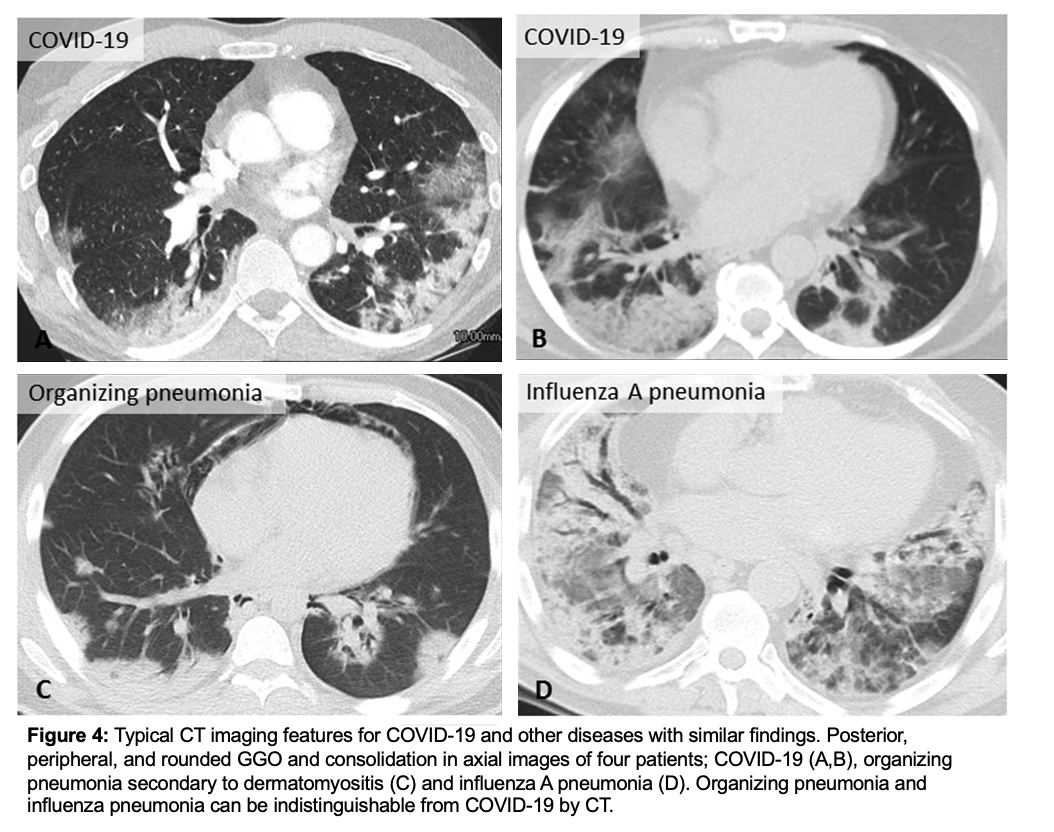 Fig. 15: Adapted from Simpson and Kay et al. [15]
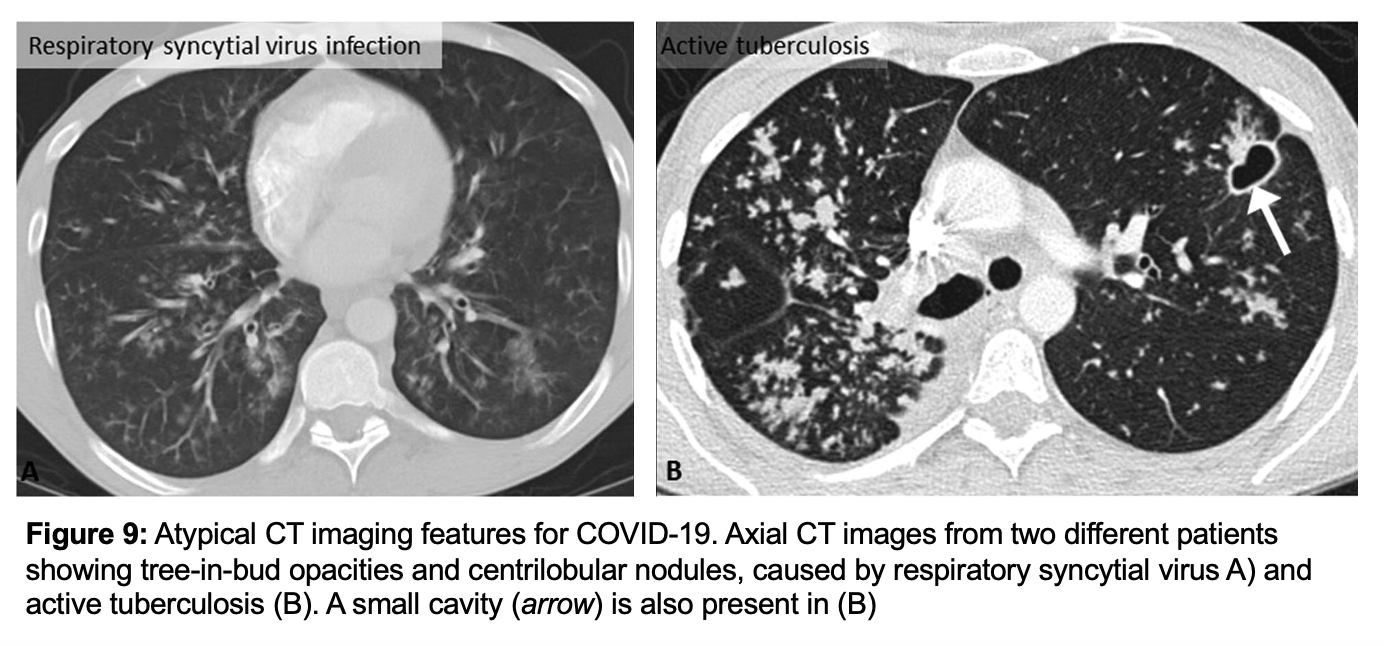 Fig. 16: Adapted from Simpson and Kay et al. [15]
Future direction includes development of an artificial intelligence classifier that can further augment radiologist performance in combination with clinical information. [16]
From my point of view, AI has the potential to:
- identify the asymptomatic carriers of COVID-19
- detect and quantify the abnormalities in serial Chest CT/X-rays scans for prognosis purpose
- distinguish CAP from COVID-19 using Chest CT scans, and additional clinical information; age, gender, previous disorders, …etc.
References:
[1] Chung, M., Bernheim, A., Mei, X., Zhang, N., Huang, M., Zeng, X., Cui, J., Xu, W., Yang, Y., Fayad, Z.A. and Jacobi, A., 2020. CT imaging features of 2019 novel coronavirus (2019-nCoV). Radiology, 295(1), pp.202–207. ( PDF)
[2] Fang, Y., Zhang, H., Xie, J., Lin, M., Ying, L., Pang, P. and Ji, W., 2020. Sensitivity of chest CT for COVID-19: comparison to RT-PCR. Radiology, p.200432. ( PDF)
[3] Xie, X., Zhong, Z., Zhao, W., Zheng, C., Wang, F. and Liu, J., 2020. Chest CT for typical 2019-nCoV pneumonia: relationship to negative RT-PCR testing. Radiology, p.200343. ( PDF)
[4] Inui S, Fujikawa A, Jitsu M, Kunishima N, Watanabe S, Suzuki Y, Umeda S, Uwabe Y. Chest CT findings in cases from the cruise ship “Diamond Princess” with coronavirus disease 2019 (COVID-19). Radiology: Cardiothoracic Imaging. 2020 Mar 17;2(2):e200110. ( PDF)
[5] Simpson, S., Kay, F.U., Abbara, S., Bhalla, S., Chung, J.H., Chung, M., Henry, T.S., Kanne, J.P., Kligerman, S., Ko, J.P. and Litt, H., 2020. Radiological Society of North America Expert Consensus Statement on Reporting Chest CT Findings Related to COVID-19. Endorsed by the Society of Thoracic Radiology, the American College of Radiology, and RSNA. Radiology: Cardiothoracic Imaging, 2(2), p.e200152. ( PDF)
[6] Ai, T., Yang, Z., Hou, H., Zhan, C., Chen, C., Lv, W., Tao, Q., Sun, Z. and Xia, L., 2020. Correlation of chest CT and RT-PCR testing in coronavirus disease 2019 (COVID-19) in China: a report of 1014 cases. Radiology, p.200642. ( PDF)
[7] Caruso, D., Zerunian, M., Polici, M., Pucciarelli, F., Polidori, T., Rucci, C., Guido, G., Bracci, B., de Dominicis, C. and Laghi, A., 2020. Chest CT features of COVID-19 in Rome, Italy. Radiology, p.201237. ( PDF)
[8] Fang, Y., Zhang, H., Xie, J., Lin, M., Ying, L., Pang, P. and Ji, W., 2020. Sensitivity of chest CT for COVID-19: comparison to RT-PCR. Radiology, p.200432. ( PDF)
[9] Wang, Y., Dong, C., Hu, Y., Li, C., Ren, Q., Zhang, X., Shi, H. and Zhou, M., 2020. Temporal changes of CT findings in 90 patients with COVID-19 pneumonia: a longitudinal study. Radiology, p.200843. ( PDF)
[10] Guan, W.J., Ni, Z.Y., Hu, Y., Liang, W.H., Ou, C.Q., He, J.X., Liu, L., Shan, H., Lei, C.L., Hui, D.S. and Du, B., 2020. Clinical characteristics of coronavirus disease 2019 in China. New England Journal of Medicine. ( PDF)
[11] Bernheim, A., Mei, X., Huang, M., Yang, Y., Fayad, Z.A., Zhang, N., Diao, K., Lin, B., Zhu, X., Li, K. and Li, S., 2020. Chest CT findings in coronavirus disease-19 (COVID-19): relationship to duration of infection. Radiology, p.200463. ( PDF)
[12] Pan, F., Ye, T., Sun, P., Gui, S., Liang, B., Li, L., Zheng, D., Wang, J., Hesketh, R.L., Yang, L. and Zheng, C., 2020. Time course of lung changes on chest CT during recovery from 2019 novel coronavirus (COVID-19) pneumonia. Radiology, p.200370. ( PDF)
[13] Wong, H.Y.F., Lam, H.Y.S., Fong, A.H.T., Leung, S.T., Chin, T.W.Y., Lo, C.S.Y., Lui, M.M.S., Lee, J.C.Y., Chiu, K.W.H., Chung, T. and Lee, E.Y.P., 2020. Frequency and distribution of chest radiographic findings in COVID-19 positive patients. Radiology, p.201160. ( PDF)
[14] American College of Radiology, 2020. ACR recommendations for the use of chest radiography and computed tomography (CT) for suspected COVID-19 infection. ACR website.
[15] Simpson, S., Kay, F.U., Abbara, S., Bhalla, S., Chung, J.H., Chung, M., Henry, T.S., Kanne, J.P., Kligerman, S., Ko, J.P. and Litt, H., 2020. Radiological Society of North America Expert Consensus Statement on Reporting Chest CT Findings Related to COVID-19. Endorsed by the Society of Thoracic Radiology, the American College of Radiology, and RSNA. Radiology: Cardiothoracic Imaging, 2(2), p.e200152. ( PDF)
[16] Bai, H.X., Hsieh, B., Xiong, Z., Halsey, K., Choi, J.W., Tran, T.M.L., Pan, I., Shi, L.B., Wang, D.C., Mei, J. and Jiang, X.L., 2020. Performance of radiologists in differentiating COVID-19 from viral pneumonia on chest CT. Radiology, p.200823. ( PDF)